Hello everyone, my CPU is working between 85% and 100% without any motive. I thought that was the Zone Alarm process that was doing it. So I changed my personal firewall to COMODO, and the thing is still happening. It’s really driving me crazy.
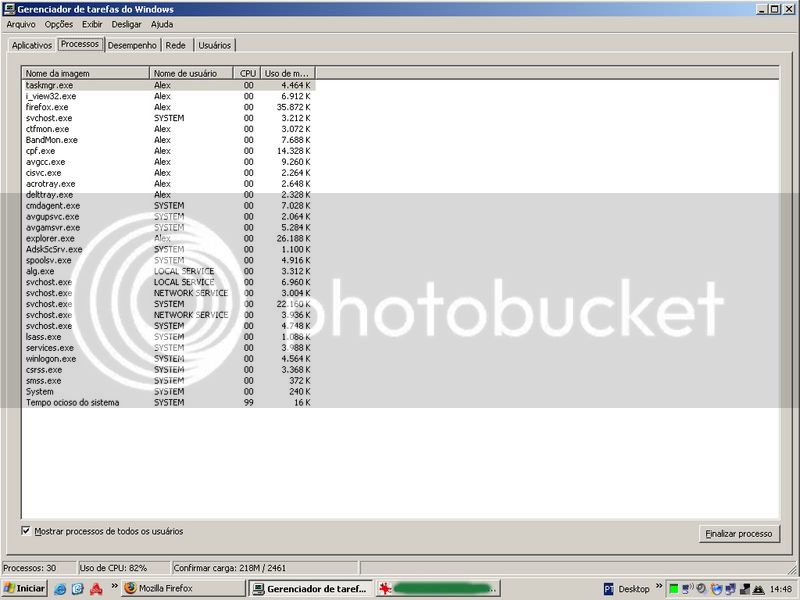
Your task manager shows the idle loop of windows is using 99% CPU.
That means no real task is consuming CPU time. Show the performance tab. The graph should be near 0.
So, do you know what’s going on with my CPU? is the graph wrong? or is the idle loop wrong? Did you ever know something like that? Is the COMODO (or any other firewall) doing it?
Well, I realized that’s just happening sometimes, but the question is: why? Today was full time and just stoped at night.
When I disable my network interface the CPU usage falls to 0%. So obviously, there’s a relation between the internet conection and the CPU usage, the case is: is the firewall doing it?
When the internet is running the CPU usage history is always near the top, and the system idle process is around 90-99%. Is there some relation between the CPU usage history and the system idle process? Is there something wrong with my settings.
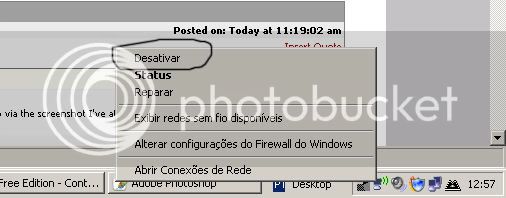
Again just to clarify how you are disabling the network interface, are you doing so via the screenshot I’ve attached, physically unplugging from the modem/router, or just closing your browser?
My conection is via wireless, and I disable my d-link wireless card by doing right click on the icon in the task bar. Where is writen “desativar” is “disable” in english I guess.
“System Idle” process should and can consume CPU. Thts not important. But If “System” (note that this is not System Idle) consumes such a significant CPU, it may be a sign of faulty driver or something else. All drivers run in the context of this process. It is worth to update your network cards driver to observe the behavior. But I assume you are not talking about “System Idle” process.
Maybe try closing all browsers and and any other network accessing apps, but leave Comodo enabled. Go to Run, type cmd hit Enter to open a command line. Then type netstat -an and Enter Look for any Established connections. There should not be any.
Otherwise I tend to agree with Egeman that it is maabe your wireless network adapter’s drivers or a problem with the card itself.
Well, I’m talking about [task manager → process → System Idle Process], here shows CPU 90-99%. But at [task manager → performance → CPU usage history] the graphic is always on the very top, near 100%. And when I disable the internet card the graphic returns to the base. Sorry if I couldn’t explain it correctly, but I’m a little lost about this case.
I just want to know why my CPU graphic usage is always on the top if I’m not using any program that is consuming it. I want to know what’s happening.
Usually, the sum of the CPU value for the System Idle Process and the general CPU usage value should be around 100%. But on your screenshot this sum is 181% (99% + 82%), which suggests that the Task Manager is not calculating your CPU usage correctly (see http://support.microsoft.com/kb/873289/en-us for more information).
Perhaps this has something to do with the bandwidth monitoring software you are using (BandMon.exe). Try to disable or uninstall it and see what happens. You could also try Process Explorer from Sysinternals http://www.sysinternals.com/Utilities/ProcessExplorer.html and see if that utility reports your CPU usage differently.
I disabled the bandwidth monitor and nothing happened.
I used sysinternals, and the screenshot is attached below. Some of the new processes found by the program I don’t know. Do you know those processes? DPCs, Interrupts… Can you or somebody give me a little explanation about the parameters painted in red on the screenshot.
My wireless signal is very low, around 20-25%, is it a problem or the cause of the problem?
You Deferred Procedure Call rate is high. I think this is about your wireless card’s driver. It must be queuing lots of DPCs. FYI, this is not related to CPF at all.
Egemen